Phylomorphospaces with ggplot in R
- Carlos Carlos-Barbacil
- 7 mar 2022
- 1 Min. de lectura
First, we load the packages "vegan", "grid", "ggplot2" and "ggphylomorpho" and our data. You can easily access and download the data of this example following this link:
You can take a quick look of the data using the function "head()". In order to visualise the phylogenetic tree of selected species you can use the function "plot()"
library(grid)
library(ggplot2)
library("ggphylomorpho")
matrix <- read.csv(file = "Data_phylomorphospace.csv", sep =";")
tree <- read.tree(file = "Tree.txt")
head(matrix) # PCoA results
plot(tree) # Phylogenetic tree of selected species
Now, we can start plotting our data!
WARNING: Note that the species' names of the phylogenetic tree and of the vector of "labelvar" must match!
setdiff(tree$tip.label, matrix$sp)
ggphylomorpho_2(tree, matrix, xvar = Dim1, yvar = Dim2,
                factorvar =Orden,labelvar = sp)
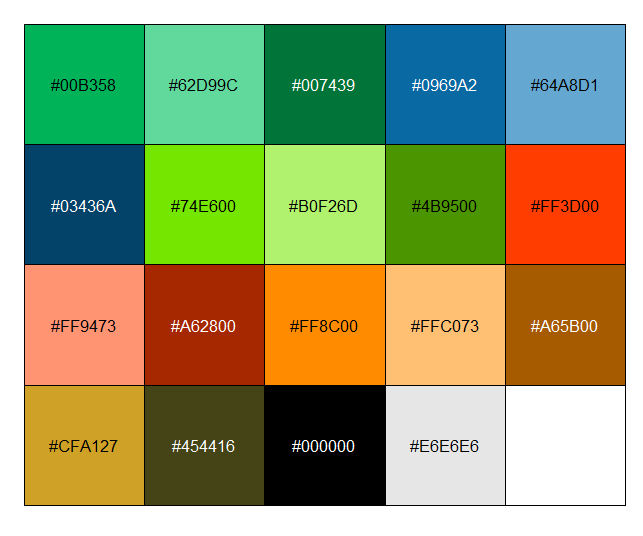
Now, it is time to start editing the plot details: the axis labels, the legend, the dot size, the margins and the colors. You can also plot your species' silhouettes available at PhyloPic.
cyprino <- "http://phylopic.org/assets/images/submissions/6af4d5e4-b0d7-454f-88fa-27871e30f561.512.png"
cyprinoLogo <- png::readPNG(RCurl::getURLContent(cyprino))
perch <- "http://phylopic.org/assets/images/submissions/7a79801e-0aae-4591-83e0-d0562f97aa0f.512.png"
perchLogo <- png::readPNG(RCurl::getURLContent(perch))
salmo <- "http://phylopic.org/assets/images/submissions/9150be88-6910-4374-aa54-a7f8f3d79fb6.512.png"
salmoLogo <- png::readPNG(RCurl::getURLContent(salmo))
cypri <- "http://phylopic.org/assets/images/submissions/25a76141-cca2-4b56-bd9f-9f5fdcd8efa1.512.png"
cypriLogo <- png::readPNG(RCurl::getURLContent(cypri))

ggphylomorpho_2(tree, matrix, xvar = Dim1, yvar = Dim2,
                              factorvar =Orden,labelvar = sp,
                              repel = TRUE, edge.width = 0.3,
                              fontface = "italic",
                              tree.alpha = 0.3, title=NULL,
                              point.size=2, point.shape=21)+
  theme_test() +
  theme(axis.text=element_text(size=12),
        axis.title=element_text(size=14),
        legend.title=element_text(size=14),
        legend.text=element_text(size=12),
        plot.margin=unit(c(0.3,0.3,0,0.3),"cm"),
        legend.position="bottom",
        legend.key.size = unit(0.6, "cm"))+
  guides(fill = guide_legend(ncol = 3))+
  xlab("PC1 (26.0%)") +
  ylab("PC2 (15.8%)")+
  annotation_custom(rasterGrob(cypriLogo),
  xmin=0.1,xmax=0.16, ymin=-0.18, ymax=-.11)+
  annotation_custom(rasterGrob(salmoLogo),
  xmin=-0.25,xmax=-0.19, ymin=0.15, ymax=0.2)+
  annotation_custom(rasterGrob(perchLogo),
  xmin=0.01,xmax=0.07, ymin=0.04, ymax=0.1)+
  annotation_custom(rasterGrob(cyprinoLogo),
  xmin=0.17,xmax=0.22, ymin=0.17, ymax=0.20) +
  labs(fill="Order")

Cano-Barbacil, C.; Radinger, J.; Grenouillet, G. & García-Berthou, E. 2022. Phylogenetic signal and evolutionary relationships among traits of inland fishes along elevational and longitudinal gradients. Freshwater Biology: in press, 1-14. [link]


Comentarios